The gap between the candle price and the liquidation threshold can make a position vulnerable even when the chart “never touched” the level.
Why the Candle Price and the Futures Liquidation Price Diverge
On futures, liquidation almost never triggers on
This guide clarifies which price is used for margin calculations and which price actually triggers forced closure:
Liquidation can look “not market-based” when the chart is drawn using
The gap between the candle price and the risk reference price most often appears when the order book is thin and a single trade moves the chart without confirmation from the index.
The largest divergence tends to occur with a thin order book, a widened spread (the gap between the best bid and best ask), and a series of market orders closing positions.
The chart records
Understanding which price draws candles and which price drives margin calculations helps avoid stop-placement mistakes (automatic position closure at an unfavorable price) and reduces the risk of unexpected forced closure.
Three Derivatives Prices: What Index Price, Mark Price, and Fair Price Mean for Margin
A derivatives venue maintains multiple prices at once:
Index Price (index price)
- Source: spot quotes from multiple venues, where weights depend on depth and quote stability.
- Use: the base reference for derivatives pricing and protection against a local skew on a single exchange.
- Limitation: the index updates with some lag and may not immediately reflect abrupt moves.
Mark Price (mark price)
- Source:
Index Price plus adjustments that reduce the impact of single trades and short-lived spikes. - Use: unrealized
PnL , current margin, and the moment a position enters liquidation territory. - Limitation: when spreads widen sharply,
Mark Price can differ materially from the chart’sLast Price .
The liquidation trigger most often compares margin to the threshold using
Fair Price (fair price)
- Source: the same inputs used to compute
Mark Price . - Use: margin and liquidation-threshold calculations in the risk engine.
- Limitation: confusion arises when
Fair Price is mistaken for the candle’s “market price.”
If an exchange shows
A single trade in a thin order book can move
Last Price: Why the Last Trade Price Produces False Liquidation Signals
The problem appears when a single trade sharply moves the chart price while the risk reference price has not changed yet.
If there are few limit orders near the market, even a small trade can “jump” through the book and print a
- Single print. One trade changes
Last Price , but the next trade returns price to the prior range. - Series of small prints. Several rapid small trades push
Last Price toward a trigger level even if order-book depth remains low. - Market closes. Liquidations execute with market orders and consume limit orders, so
Last Price becomes a noisier source in the moment.
A stop order often triggers on
The gap between
Mark Price vs Last Price: Where the Mistake Comes From — and How to Verify It on the Chart
Candles are drawn using
The chart-reading mistake happens when stops and expectations are tied to
Last Price reacts sharply to single prints and thin book depth.Mark Price is based onIndex Price plus smoothing, so it doesn’t mirror every tick.- Liquidation price is compared against
Mark Price orFair Price , not the candle price. - Execution price is formed by the order book and depends on spread and available opposing volume.
Scenario: the
Liquidation looks “weird” when
Liquidation is tied to the risk reference price, not to the last trade on the chart.
A trigger based on the risk reference price separates risk checks from random prints, so forced closures don’t become the cause of more forced closures.
Why Liquidation Isn’t Calculated on Last Price: What the Exchange Risk Engine Does
The risk engine closes a position when margin computed on
Liquidation executes as a market order and therefore influences the order-book price. If liquidation timing were determined by the last trade, each forced close could immediately worsen conditions for other positions.
Reason: if the trigger were based on
When
Using
The quality of
Index Price: How the Index Is Built — and What to Check in the Source Basket
The index typically uses liquidity-based weights and outlier filters: a source with an abnormal deviation gets less weight or is temporarily excluded.
- Source weights. A venue with deeper spot liquidity typically influences the index more.
- Outlier filtering. Prices that deviate materially are weighted less or temporarily removed.
- Update frequency. More frequent updates improve responsiveness but increase noise risk.
- Time synchronization. Quotes are aligned to the same moment so one venue’s delay doesn’t distort the index.
Example: on one exchange, the last trade price jumps due to lack of orders, but
The
Mark Price and Fair Price: What Makes Up the Risk Reference Price
Different exchanges use different formulas, but the principle is the same:
In perpetual futures, the contract price can deviate from spot for a long time. To prevent such a skew from persisting, exchanges use a
If the futures price stays above spot for a sustained period, longs pay; if it stays below, shorts pay. This makes maintaining a persistent skew costly over time.
That’s why the risk reference price can differ from the candle price, and
Extreme
Funding Rate and Mark Price: How Long/Short Imbalance Increases Liquidation Risk
When periodic
What to watch when funding is high:
- How much margin buffer exceeds the minimum required level.
- Whether the account uses cross balance or fixed collateral per position.
- Whether there is sufficient order-book depth near the close price.
- How far the risk reference price differs from the chart price.
- How costly it is to hold the position at the current rate.
High
Rising
Open Interest: Why Rising Open Contracts Increase Cascade Probability
Risk rises sharply when open positions grow beyond what the market can close smoothly.
In that situation, even a small move can force positions to close at market.
- Rising
OI with flat price often means leverage is building without a clear market direction. -
Rising
OI while order-book depth deteriorates increases slippage risk (when a position closes at a worse price than expected due to insufficient liquidity). - Falling
OI more often coincides with leverage being flushed after a wave of closures. - Liquidation clusters form where many positions share similar margin buffers and similar stop settings.
High
Percent moves mean little without leverage; the better reference is distance to liquidation on
Leverage and Liquidation Risk: Distance-to-Mark-Price Benchmarks
The higher the leverage, the smaller the
| Leverage | Approx. Distance to Liquidation | How to Read the Risk |
|---|---|---|
| 2× | ≈ 49.5% | Low risk under normal volatility |
| 5× | ≈ 19.5% | Moderate risk |
| 10× | ≈ 9.5% | Meaningful risk, especially around news |
| 20× | ≈ 4.5% | High risk: a small move can close the position |
| 50× | ≈ 1.5% | Critical: the position is almost always “on the edge” |
| 100× | ≈ 0.5% | Almost any move can cause liquidation |
This table is a benchmark. Actual distance to liquidation depends on
Liquidation starts when margin, computed on
The Exchange Liquidation Engine: How the Threshold Is Calculated — and How Forced Closure Executes
The risk engine compares current margin to
Liquidation begins when funds backing the trade are no longer sufficient to close the position at market after fees.
The liquidation threshold is a check: whether collateral is enough if the position must be closed immediately.
- Margin and
PnL calculation.- Unrealized
PnL is calculated onMark Price , not onLast Price . - Current margin is compared to
maintenance margin . - Fees, liquidation costs, and execution costs are included.
- Unrealized
- Forced-close trigger.
- Threshold breach is detected on
Mark Price orFair Price . - An execution mode is selected: full close, partial liquidation, or staged deleveraging.
- Execution goes through the order book and depends on spread and depth.
- Threshold breach is detected on
- Deficit coverage if execution goes “below zero.”
- An insurance fund covers deficits under adverse execution.
ADL reduces opposing positions if the deficit exceeds the fund’s capacity.- Partial liquidation reduces the position to restore margin above the threshold.
The liquidation threshold is calculated on
The threshold marks the moment margin becomes insufficient on
Liquidation cascades accelerate because market orders sequentially consume limit orders; when leverage concentration is high, the move speed spikes.
Why Liquidations Accelerate Moves: A Chain of Triggers and Market Orders
Liquidations execute as market orders, so they consume limit orders and widen spreads — especially under high leverage concentration.
Each forced close adds market volume in the direction of the move, so a series of liquidations accelerates the impulse.
-
The risk reference price reaches risk levels across multiple positions.
- The check is done on
Mark Price , not on a single trade price. - Positions with similar margin buffers can be closed at the same time.
- The check is done on
-
Positions close at market and worsen execution.
- Market closes remove available orders from the book.
- With weak liquidity, price shifts more than usual.
-
The next price shift impacts the next set of positions.
- Positions with nearby margin buffers move into risk.
- The process stops when sufficient opposing liquidity appears.
A series of liquidations accelerates the move because market-close orders repeatedly “eat” the order book in one direction.
Liquidations don’t dampen impulses — they amplify them through market execution and slippage.
A “no candle touch” liquidation happens because risk checks and chart candles are sourced from different prices.
“No Candle Touch” Liquidation: Five Causes to Verify on an Exchange
By “candle touch,” people usually mean the moment the chart price reaches a stop or liquidation level. But exchanges compute risk using a different price, so liquidation can trigger before the candle visually reaches the level.
- Different prices for chart vs risk. Candles are built from
Last Price , while liquidation is computed onMark Price . - The risk price is smoothed.
Mark Price doesn’t react to every single trade as quickly as the chart price. - Weak liquidity. A single trade can briefly move the candle price without a broader market move.
- Market execution. Forced closure executes against available orders and can fill worse than the reference level.
- Position costs. Fees and margin mode reduce available collateral and pull liquidation closer.
Example: the book is thin, market closures push execution,
A “no candle touch” liquidation is not a chart bug — it’s a consequence of risk being computed on a different price than the candle displays.
Maximum vulnerability appears when leverage,
Pre-Entry Check: When Forced-Liquidation Risk Is at Its Highest
Risk increases when leverage and open positions build faster than the order book can absorb market orders without slippage.
Before entering a position, it makes sense to check not only the scenario, but also the margin buffer relative to the threshold on
Signs liquidation risk is maximal:
- Sharp, brief price moves with weak order-book depth.
- A large gap between bid and ask near the liquidation level.
- Many positions with similar margin buffers that could close at the same time.
- Very high
funding rate , making positions expensive to hold. - Rising
Open Interest without an increase in order-book liquidity. - A news impulse after which orders disappear from the book faster than usual.
If a stop and a liquidation level are too close, market execution can close the position at a worse price than expected.
Maximum risk appears where a thin book and high
A stop may not trigger first if it’s tied to one price while risk is computed on another.
Stop Orders and Trigger Price Source: Why Trigger Order Matters
A stop order typically reacts to the chart price, while liquidation is computed on a risk reference price.
A stop limits losses, but the risk engine has priority: if margin is insufficient, the position is forcibly closed.
When the stop is too close to the liquidation level and is tied to the candle price, the position can be closed earlier — on the risk reference price.
- The price source that triggers the stop. Order settings may use chart price or a reference price.
- Buffer to liquidation. There should be a gap between the stop and the risk level.
- Close method. Market closes can produce worse execution than expected.
- Margin mode. With cross balance, losses in other positions reduce available buffer.
A stop placed near the liquidation level may not have time to trigger if the risk reference price reaches the threshold first.
For a stop to do its job, it must be placed with the price the exchange uses to compute risk in mind.
Margin mode determines which capital participates in liquidation: only the position or the entire account balance.
Cross Margin vs Isolated Margin: How Mode Changes Liquidation
With cross margin, risk is computed on the full account balance; with isolated margin, only the position collateral is used,
so liquidation timing on
- Cross margin. The entire account balance backs liquidation; the position can survive longer, but one mistake can impact other trades.
- Isolated margin. Risk is limited to position collateral; liquidation happens sooner, but the rest of the balance is not affected.
Choosing a margin mode doesn’t change the liquidation formula, but it determines
how much capital is considered when checking the threshold on
Even when metrics share the same names, exchanges differ in reference-price inputs and smoothing rules, so risk-trigger timing can vary.
Exchange Differences: What to Compare in Mark Price, Index Price, and Stop Triggers
Key exchange differences come from how
UI metric names may match, but the internal logic and data sources can differ.
On each contract, it’s worth checking three things:
which price is used to compute unrealized
| Metric | What it is | Where it’s used | Strength | Limitation |
|---|---|---|---|---|
| Last trade price | Candles, some stop orders | Reflects trades quickly | Can be briefly distorted under weak liquidity | |
| Average spot price | Base for reference prices | Reduces local distortion impact | Responds slower than single prints | |
| Risk reference price | Fewer false triggers | Requires understanding how it’s computed |
Practical test:
enable the
For risk control, it helps to monitor
Understanding the price sources and triggers on a specific contract matters more than identical UI labels.
Lower leverage and higher margin buffer reduce liquidation probability, but a thin order book and overheated derivatives demand can bring risk back within minutes.
Mark-Price Risk Management: How to Reduce Liquidation Risk on Futures
Liquidation depends on leverage, margin buffer, and order-book depth, because the threshold is set on
Reducing liquidation risk starts with leverage and margin-buffer settings, not with trying to guess reversals.
What reduces liquidation risk fastest:
- Lower leverage to increase distance to the threshold on
Mark Price . - Increase margin buffer so fees and slippage don’t “eat” remaining collateral.
- Reduce position size on instruments with thin order books and wide spreads.
- Separate stop level and liquidation threshold using the reference price, not candles.
- Monitor
funding rate andOpen Interest in overheated moments when cascades are more likely. - Take partial profits if rising volatility starts worsening execution through the book.
If the stop level is close to the liquidation threshold, risk management is effectively handed to the risk engine and market execution.
Smaller size, larger margin buffer, and a correct stop-trigger source reduce liquidation odds during wicks and cascades.
Answers to common questions help explain why liquidations look different from what the chart suggests.
FAQ: Mark Price, Index Price, and Futures Liquidations
Why does the liquidation price differ from the chart’s market price?
Candles are built on
Can a stop-loss be set to trigger on Mark Price?
On some venues, you can choose the stop trigger source:
What matters more for cascade risk: funding rate or open interest?
Why is the actual close price worse than the liquidation reference price?
The reference price defines the trigger, but execution happens through the order book as a market order. With wide spreads and low depth, fills move worse than the trigger level due to slippage.
What actions reduce liquidation risk the most?
The fastest effect comes from lower leverage and higher margin buffer because they increase distance to the threshold on
Most “weird” liquidations are explained by different price sources and market execution through the order book.
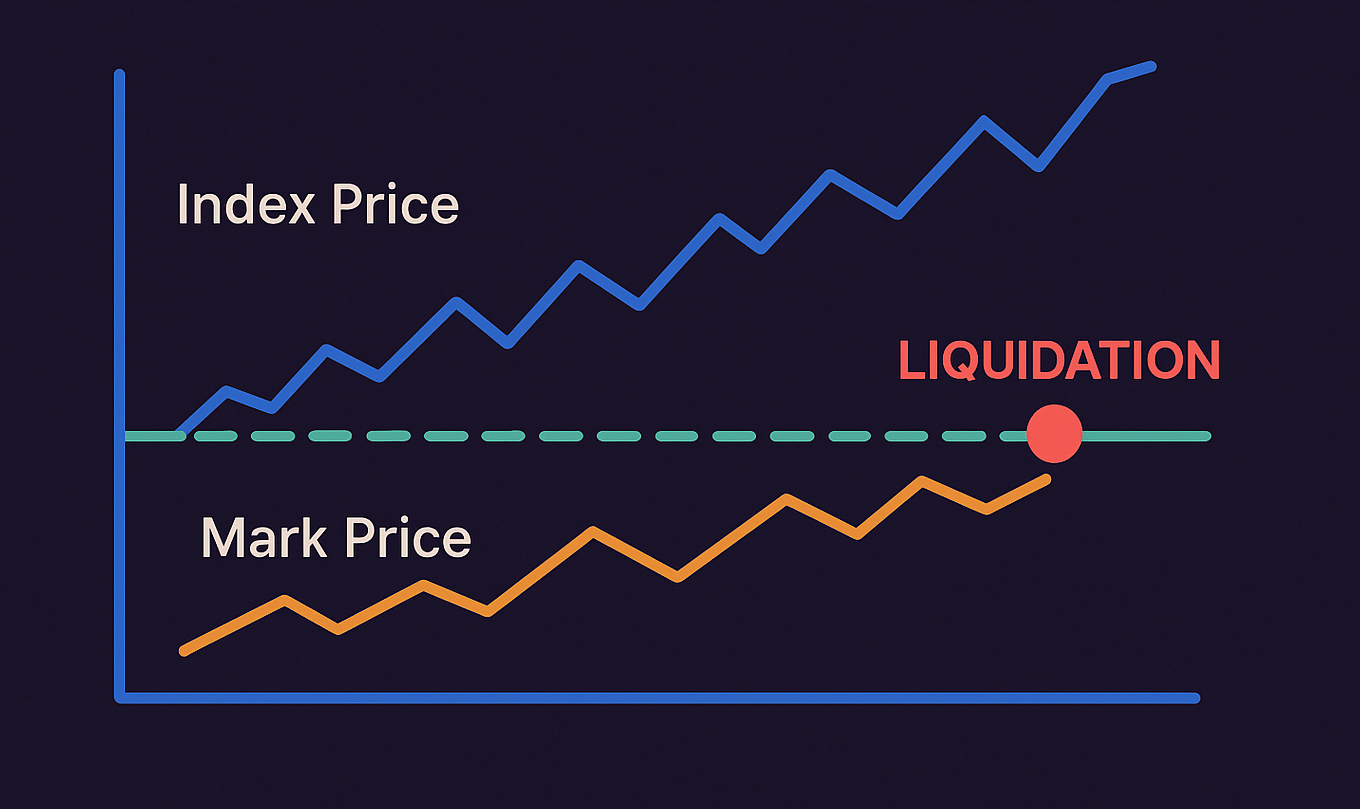
This summary ties price sources to forced-close risk: candles, margin, and execution run on different prices, and the gap is always paid for by margin.
Mark Price and Liquidations: Which Price Triggers Risk — and Which Price Draws Candles
For risk calculations, the exchange uses a different price —
If stops and expectations are tied to